What Moves a Stock Price
Every trader has watched a stock suddenly explode higher on massive volume — only to fade just as fast. But why does it happen? At the core, **stock prices move because of supply and demand.** When more traders want to buy than sell, the price rises. When sellers outnumber buyers, it falls. Everything else — charts, filings, sentiment — ultimately ties back to that one dynamic.
The Core Drivers
There are **three primary forces** that move a stock in the short term:
- Catalysts – News events, press releases, partnerships, earnings, or fresh filings that create new reasons to buy. A small-cap biotech announcing FDA progress, or a microcap tech company signing a new distribution deal — both can spark demand instantly.
- Liquidity and Float – The fewer shares available to trade, the faster price can move. A “low-float” stock can jump 100% on what looks like average volume simply because there aren’t many shares available.
- Trader Perception – Psychology moves markets as much as data. Social media chatter, FOMO (fear of missing out), and herd mentality can send small caps soaring — even without big news.
In other words: Fundamentals explain why a stock should move.
Trader psychology determines when and how far it actually does.
Understanding Catalysts vs. Reactions
Not all news is created equal. A strong catalyst gives traders a reason to act — but how they react depends on timing and context.
| Type of Catalyst | Typical Market Reaction |
|---|---|
| Positive press release (partnership, funding) | Initial buying spike; may fade if volume is thin |
| SEC filing (S-1, EFFECT notice) | Can trigger fear or profit-taking |
| Industry sympathy (sector momentum) | Short-lived volume surge; often fades within hours |
| Reverse split or dilution event | Usually short-term drop, possible future volatility |
Quick Tip: Stocks don’t move on what happened — they move on what traders think happens next.
How This Ties Into Momentum Stocks
Everything discussed here — catalysts, float, psychology, and liquidity — directly feeds into **momentum trading setups.** Once you understand what makes price move, you can start recognizing when it’s likely to happen again.
The Anatomy of a Momentum Move
How demand builds from catalyst to climax (and what to look for at each stage).
1. News Catalyst
Unexpected positive PR, FDA announcement, or large contract. Creates the initial reason to buy.
2. Volume Spike
Pre-market or opening bell surge in trading volume. Confirms initial trader interest and liquidity.
3. Breakout/Halt
Price breaks key resistance levels on heavy volume, leading to volatility halts (LULD).
4. Climax / Trap
Highest volume and most aggressive buying. Often the point where early traders take profit. Reversal risk is high.
5. Consolidation
Volume dies down. Price finds a new, lower range. The remaining volume determines if a second leg is possible.
Recognizing these stages isn't about predicting the top; it's about defining your entry and **exit** strategy based on where the crowd is in the cycle.
Reading the Chart (and Why It Matters)
Every price move tells a story — and charts are how traders read it. A stock chart isn’t just a set of lines and colors; it’s a real-time record of how buyers and sellers are reacting to news, emotion, and opportunity. Learning to read charts gives you a major edge, especially in fast-moving small-cap markets.
Candlesticks Explained
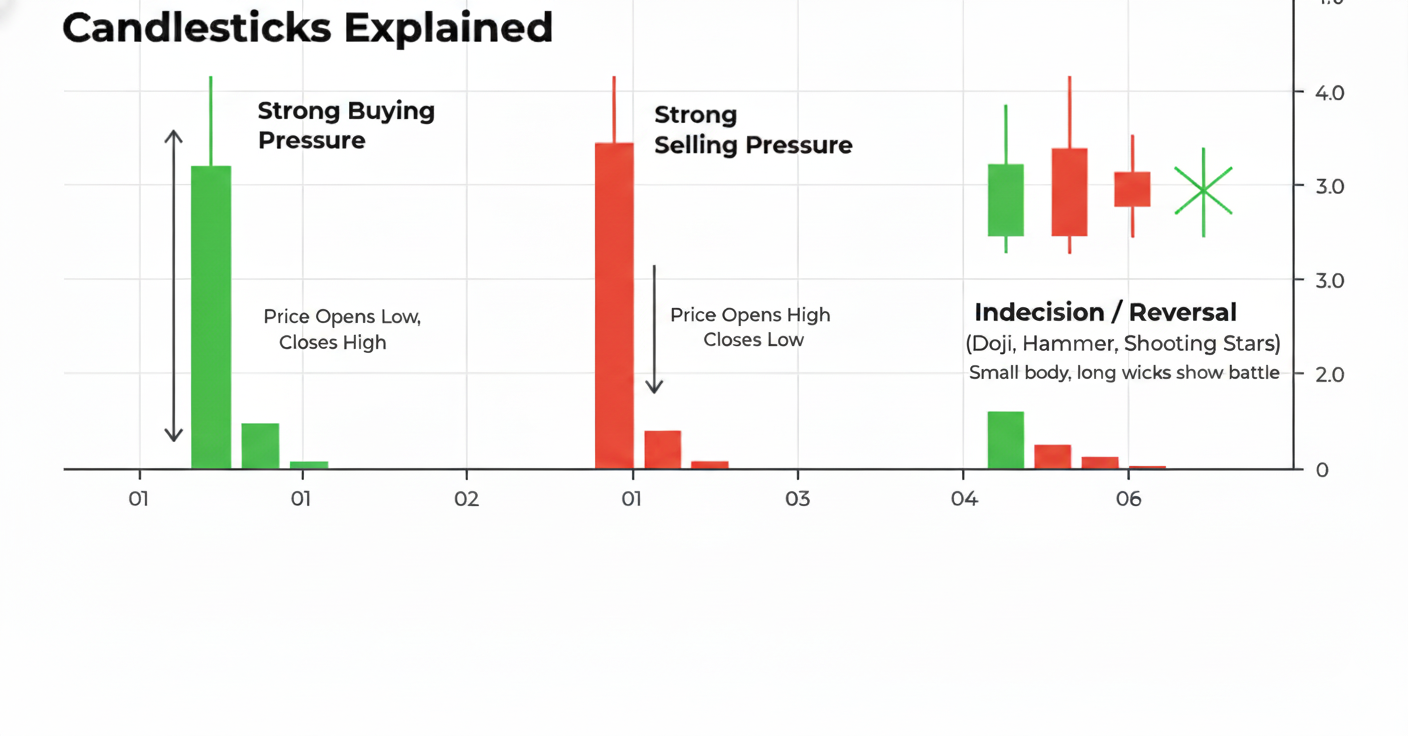
Each candlestick on a chart represents the battle between bulls and bears over a specific period of time. The body shows where price opened and closed. The wicks (or shadows) show how high and low price moved during that period.
- A long green candle shows strong buying pressure — buyers controlled that period.
- A long red candle shows strong selling pressure — sellers dominated.
- Small bodies with long wicks (dojis, hammers, shooting stars) often mark indecision or reversal points.
Quick Tip: The story changes as each candle forms. Zoom out to see the bigger pattern before reacting to one dramatic move.
Why Volume Confirms the Story
Volume is how you separate real moves from fake-outs. A breakout on high volume means traders agree with the move. A breakout on low volume often fades quickly.
When studying charts, always ask: Is this move supported by participation? That one question will save you from many false signals.
The Role of VWAP
The Volume-Weighted Average Price (VWAP) shows the average price traders have paid throughout the day. It acts like a magnet — when price is above VWAP, buyers are in control; when below, sellers dominate.
Momentum traders often use VWAP as a line in the sand for entries and exits. It’s the single most referenced indicator among short-term small-cap traders.
For a deeper look at how VWAP shapes intraday setups, visit our Momentum Stocks Guide →
Understanding Volume and Liquidity
Volume is the fuel of momentum. Without it, price can’t move far. Liquidity — the ability to buy or sell quickly without huge slippage — is what keeps you in control of your trades.
Average Daily Volume (ADV)
ADV measures how many shares trade on an average day. A stock trading millions of shares daily tends to have tight bid-ask spreads and predictable movement. Thinly traded tickers, by contrast, can gap violently on small orders.
Float and Volatility
The float is the number of shares actually available for public trading. Low-float stocks move faster because each buy order eats up a larger portion of available supply. That’s why a 3 million-share float reacting to one strong catalyst can double in minutes.
Remember: Low float means fast moves — both up and down. Always size positions smaller when liquidity is thin.
Volume Spikes as Early Warnings
When a quiet stock suddenly trades 5-10 × its average volume, something’s happening. Maybe news leaked. Maybe chatrooms picked it up. Either way, volume usually arrives before headlines. Experienced traders learn to spot this shift early.
Pro Tip: Watch how volume behaves at key levels. A breakout that holds on rising volume often signals real momentum forming.
Managing Risk (Before It Manages You)
Ask any veteran trader what matters most, and they’ll say the same thing: risk management. In small-cap trading, volatility is both your biggest opportunity and your biggest threat. Protecting your capital isn’t optional — it’s the foundation of longevity.
Position Sizing
Before every trade, decide how much you’re willing to lose if you’re wrong. Many pros risk only 1–2% of their total account on any single trade. That small discipline keeps emotions in check and prevents one mistake from ending your week.
Stop-Loss Discipline
Set stop-losses where the trade idea is invalidated, not just where it “feels safe.” Mechanical, pre-planned exits beat emotional decisions every time.
Capital Preservation Over Bragging Rights
The traders who last aren’t the ones with the biggest wins — they’re the ones who avoid catastrophic losses. Every dollar you keep is one you can redeploy when the next setup appears.
Quick Tip: Professional traders think about risk before reward. Every trade should have an exit plan.
Using Risk-to-Reward Ratios
Aim for trades where your potential reward is at least twice your potential loss (2 : 1). This simple rule means even if you’re wrong half the time, you can still come out ahead.
Example: If you risk $100 on a setup that could make $200, five winners out of ten trades would put you in profit.
Emotional Discipline
The hardest part of trading isn’t finding the setup — it’s managing yourself once you’re in it. Fear, greed, and impatience have ended more trading careers than bad charts ever could.
Common Emotional Traps
- FOMO (Fear of Missing Out) — Jumping into a trade just because it’s moving. By the time it feels “safe,” it’s often too late.
- Revenge Trading — Trying to win back losses immediately after a bad trade, usually by taking poor setups.
- Overtrading — Forcing action on a quiet day instead of waiting for high-probability setups.
- Recency Bias — Assuming the last result predicts the next one. Markets change faster than memory.
Building Discipline
Keep a trading journal. Note not just entries and exits, but emotions you felt during the trade. Over time, patterns will emerge — and awareness turns bad habits into strengths.
Set specific trading hours, screen time limits, and “walk-away” rules. Sometimes, the best trade is taking a break.
“In small-cap trading, the hardest battle isn’t on the chart — it’s in your own head.”
Emotional control doesn’t mean suppressing feelings; it means recognizing them before they control your decisions. The goal isn’t perfection — it’s consistency.
Next Step: Combine everything you’ve learned — catalysts, charts, volume, risk, and discipline — to start identifying momentum setups in real time. That’s where the Trojan Stocks edge begins.
The Trading Readiness Checklist
Before executing any trade, ensure you can check off every item below:
- I have defined my entry price and volume target.
- I have set a clear stop-loss (maximum acceptable risk).
- I know my profit target and plan for taking scale-out profit.
- The trade size is less than 5% of my total trading account.
- I understand the primary catalyst and float status of the stock.
- My emotions (FOMO, fear) are controlled and not influencing the decision.