Trend Bias Filter
If price is holding above VWAP, the trend is generally bullish for the session. Align your long ideas with this bias. Flat or short ideas should be considered below it.
Anchor your bias with Volume-Weighted Average Price (VWAP), confirm moves with Relative Volume (RVOL), and execute with high precision. This guide turns the day’s “fair price” and participation into clear, repeatable trade triggers.
Open the VWAP Quick ReferenceWhat you’ll master in this VWAP & Volume deep dive:
VWAP (Volume-Weighted Average Price) is the average price paid for a stock today, weighted by the amount traded at each price. Traders use it as a real-time “fair value” anchor: **above VWAP** suggests buyers are in control, **below VWAP** suggests sellers.
If price is holding above VWAP, the trend is generally bullish for the session. Align your long ideas with this bias. Flat or short ideas should be considered below it.
VWAP provides a clear invalidation level. When entering a long near VWAP, your hard stop should be a clean loss of the line. No averaging down past this point.
Breakouts that occur **with high RVOL** and hold above VWAP have higher odds of trending. VWAP separates high-probability continuations from mean-reversion chop.
“VWAP shows where most money changed hands today. If price is above it and volume is strong, the crowd is paying up, confirming a trend.”
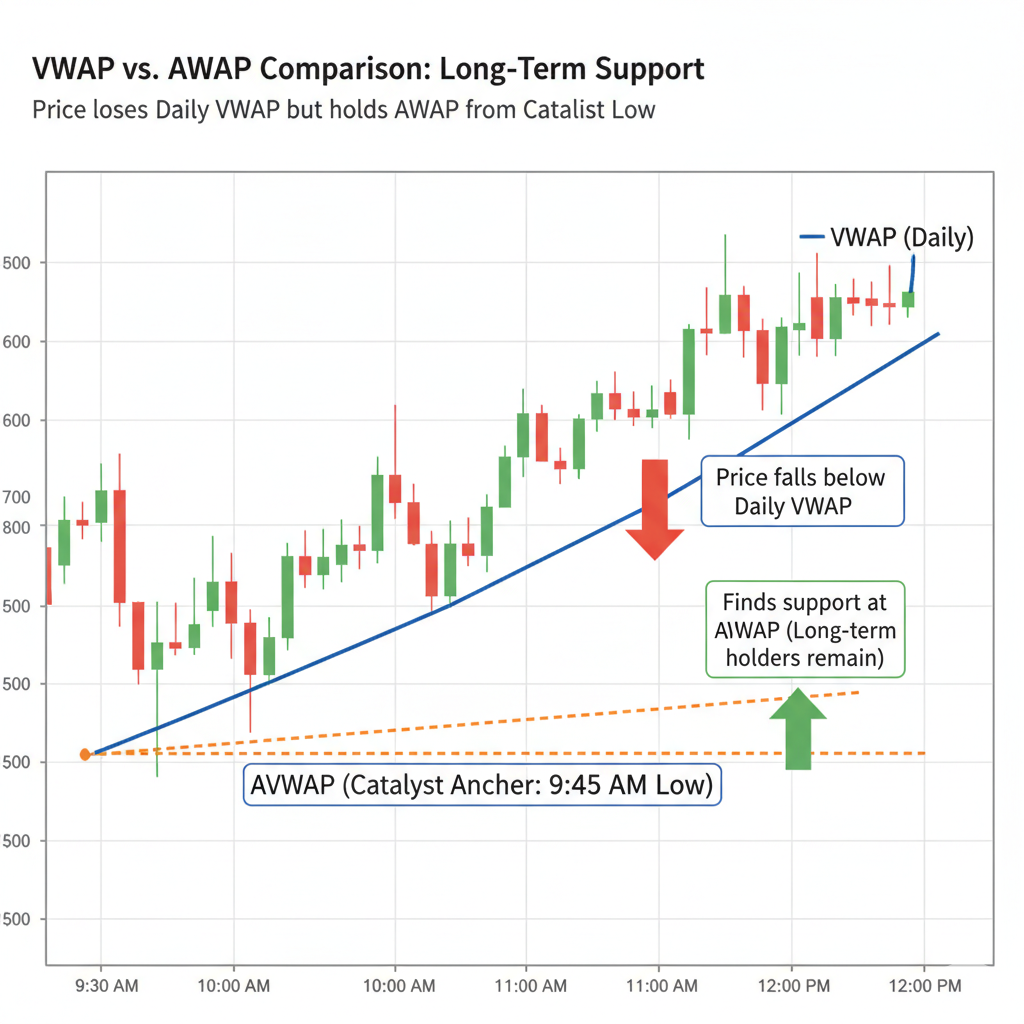
While standard VWAP resets each day, **Anchored VWAP (AVWAP)** starts the calculation from a specific, significant event. This allows you to track the average cost basis of traders since a major catalyst or pivot point.
VWAP is the map, but **Volume is the fuel**. Without participation, price moves are unreliable. We use Relative Volume (RVOL) to determine how engaged the market is compared to its average behavior.
| Signal | VWAP Context | Action |
|---|---|---|
| RVOL ≥ 2x early | Price holding VWAP | Focus list; look for long triggers at VWAP/levels. |
| Breakout on RVOL ≤ 1x (RVOL is less than one time) | Price far from VWAP | **Avoid.** Likely low conviction and prone to fading. |
| Pullback on declining volume | Price dips toward VWAP | Healthy consolidation; look for a higher low entry near the line. |
| Heavy volume slam back | Price loses VWAP after reclaim | **Exit.** The risk line failed with strong supply confirmation. |
The Golden Rule: No RVOL, no trade. Volume is your definitive confirmation that a move, even around VWAP, has genuine support.
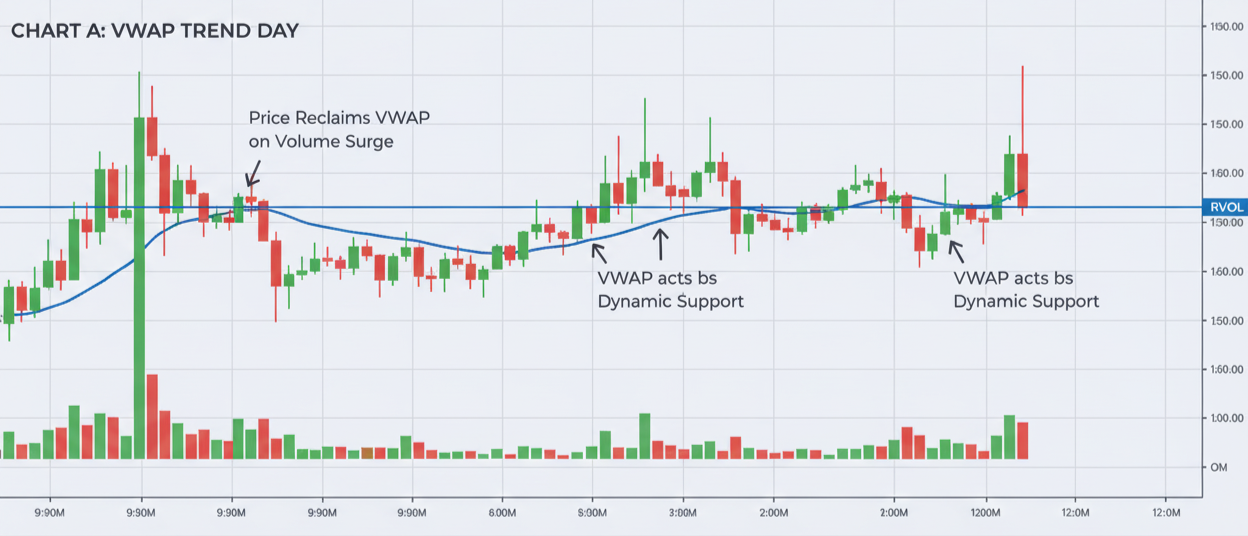
These are the four high-probability, repeatable scenarios involving VWAP and volume. Each requires a clean VWAP line (not a sloppy, flat one) and strong RVOL.
Strong momentum name dips below VWAP briefly.
Clean reclaim + hold above VWAP with rising RVOL.
Hard stop immediately on VWAP loss.
Intraday resistance / HOD.
Price consolidates tightly right above VWAP.
HOD break on accelerating RVOL.
Back under HOD level or VWAP loss.
Next whole/half dollar; 1:2 R/R minimum.
First clean pullback to VWAP after expansion.
Higher low candle near VWAP with supportive tape.
Tight stop under the pivot low or VWAP.
Retest HOD; partials at round levels.
Failed reclaim attempt; dilution risk present.
Rejection wick + clean VWAP loss on rising sell volume.
Above the reject wick or VWAP reclaim.
Prior support / VLP (Volume Profile Lows).
A perfect setup means nothing without sharp execution. In fast-moving names, small errors in order placement can ruin R/R. **Discipline is the key to profit-taking**.
Use **Limit Orders** around key VWAP and support/resistance levels. Avoid Market Orders on volatile stocks to prevent catastrophic slippage.
Trade confidently on **tight spreads** and quick fills. When spreads widen, reduce size or skip the trade due to increased slippage risk.
Take **partials (trims)** into strength at every whole/half dollar or prior high. This protects capital and allows you to trail the rest risk-free.
Risk Line Discipline: If price crosses and holds past your defined VWAP/level risk line, **you are out**. Averaging down on a failed thesis turns small losses into blow-ups.
Analyze these two common chart patterns. (Replace placeholders with your chart images.)

Pair this lab with your VWAP & Volume Cheat Sheet for step-by-step walkthroughs.
Use this scorecard before every VWAP-based trade to confirm your plan and manage risk.
Follow real-time momentum with levels, RVOL, and dilution context on the Heat List.
Sharpen the fundamentals: charts, risk, and discipline.
Turn VWAP and volume into rule-based entries and exits.
Understand when supply hits the tape so you don’t buy into it.